How to Make the Most of Showroom Exchange’s Software for Sales Reps

Showroom Exchange gives accessory and apparel showroom sales reps what they need more of—time to sell. Showroom Exchange always improves results- personalized marketing, simplified commissions and sales, and maintenance-free services, are tools that lead you to success. Whether you’re new to Showroom Exchange’s online sales software or you’ve been a subscriber for years, here’s how to make sure you’re getting the most out of our products and services.


Stay on Top of Customers

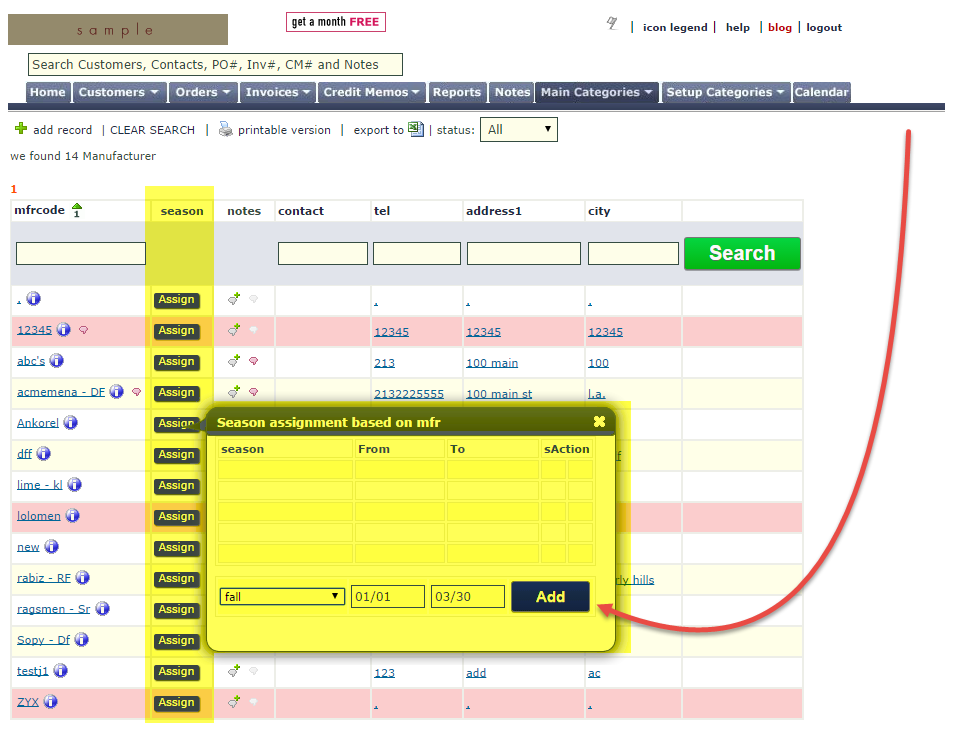
If you’re still using spreadsheets to track customers, now is the time to migrate to Showroom Exchange’s online sales software. Our innovative platform allows you to manage customers and their contact data, track sales, and even record customer contact history so you can get a quick snapshot of their past. It also gives you insight into how to keep them interested in future products.


Simplify Email Marketing

Showroom Exchange offers a personalized bulk email marketing solution that allows you to send and manage email campaigns, fax newsletters (using a 3rd party service such as maxemail.com), and track their deliverability and open rates. You don’t have to pay for other email marketing services anymore. The email marketing solution is fully integrated, which streamlines your operations, provides vital business data, and saves your showroom money in the process.


Fill in Gaps and Maximize Sales

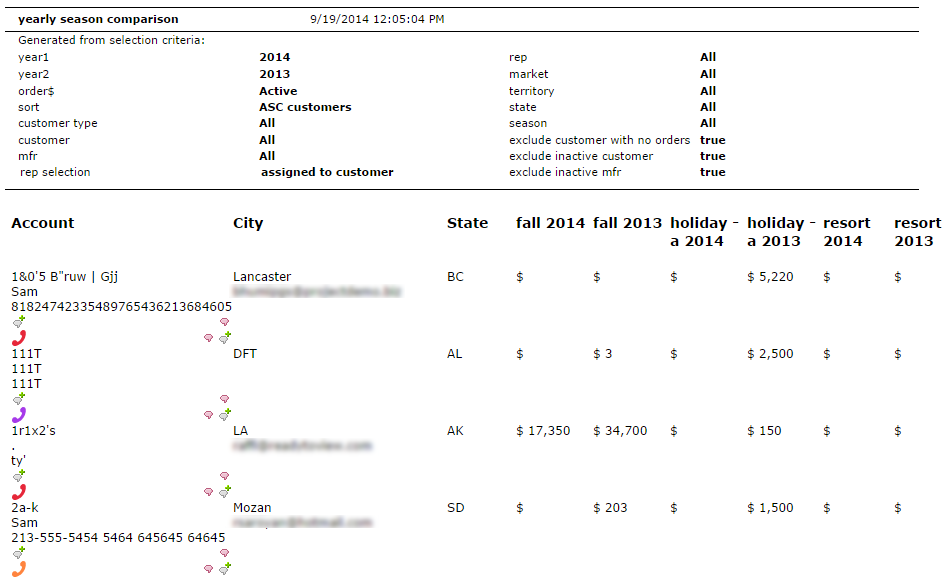
Missed orders can severely influence your company’s sales revenues. With Showroom Exchange, you can easily identify those missed sales and get in touch with customers right away to fill their orders.


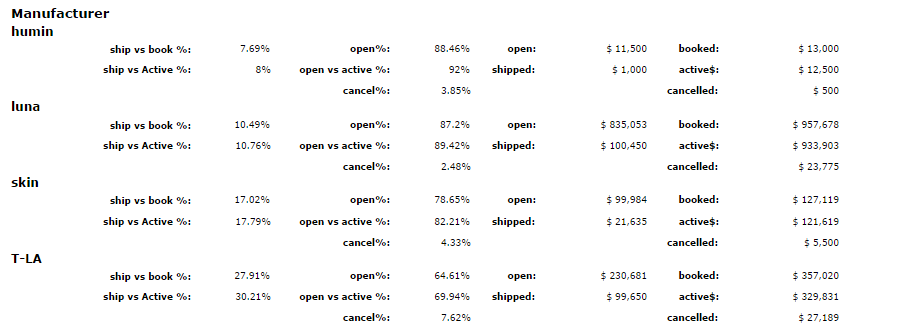
Track Sales Commissions More Efficiently

The use of spreadsheets is archaic, decentralized, and time consuming. Showroom Exchange allows you to track your sales staff’s commissions. Everything is consolidated. You can generate detailed commission reports on each sales representative, saving you the hassles of manually calculating commissions for each pay period.


Never Miss an Open Order

Your business is only as successful as your brand’s delivery rate. If customers have to wait for their orders, they may lose interest in the specific brand that has delayed delivery. With Showroom Exchange, you can track open orders and even forward them to the manufacturer for payment and status updates.


Stay on Top of Your Showroom While on the Move

Excel spreadsheets and traditional sales software don’t go where you go, but Showroom Exchange does. We offer maximum accessibility—whether it’s from your computer, mobile device, or tablet. Our online sales software allows you to access orders, track customer data, and even track email marketing campaigns while you’re away.


Follow-up More Efficiently

Simply contacting customers from time to time is not enough—you also need to follow-up with them to ensure that they stay informed about new collections from your lines. Showroom Exchange allows you to tag customers for future follow-up and keep those hot leads “hot” so that you don’t miss potential sales.


Scan and Retrieve Faster

Whether you’re at the showroom, at a tradeshow, or on the road, you have the option to view order scans. If a customer ever has an inquiry, you can simply forward a copy of the order with a click of a button—regardless of location.


Say Goodbye to Maintenance Hassles

On top of I.T. administrative efforts, traditional sales software requires you to update and frequently purchase newer versions. But Showroom Exchange eliminates the hassle and costs of updates. We maintain the software for you. There is no download or installation required, and you don’t have to worry about a backup policy. Since our software is online and centralized, updates are deployed very quickly with minimal service impact during off-hours..


Save on Tech Costs With Unlimited Free Support

We understand that there is a lot to learn with Showroom Exchange, and we want you to get the most out of our online sales software and its systematized approach to effectively manage your showroom. That’s why we offer unlimited free support for every customer. We’re a one-stop shop. Given the common platform, the web-browser, we do not have to defer you to a third-party tech support when addressing common issues.


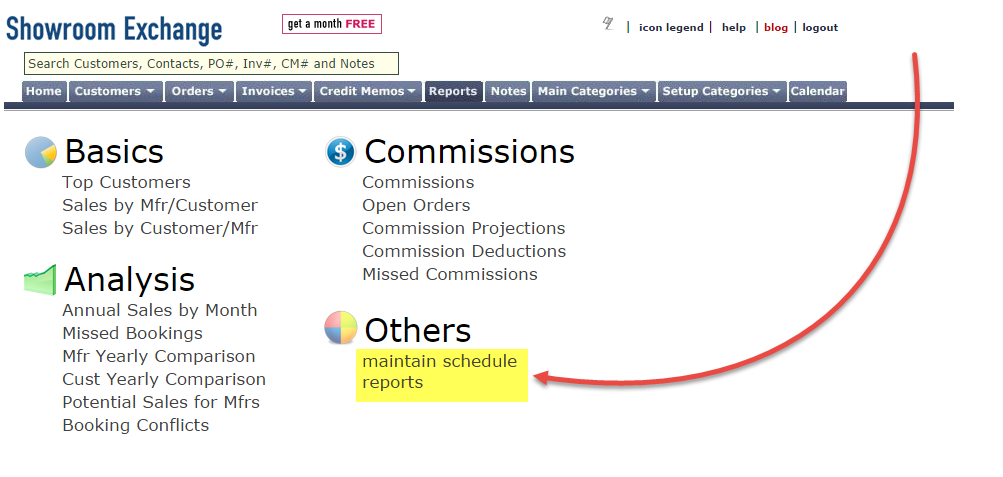
Showroom Exchange brings intelligence and efficiency to the management of your accessory or apparel showrooms to avoid missed bookings, capture uncollected commissions, and accurately analyze the health of your business. View a brief demo or call 213.438.0600 ext. 1 for a more personalized and in-depth demo.

Commissions Report

Use the commissions report to determine what is owed to you (the showroom) and what has to be paid out to your reps. The commissions report depends on consistent entry of commission statements (as invoices in Showroom Exchange). The commission entry process is VERY important as the information is used to determine the mfr’s ship-thru %, help determine what is still left open (more on open orders report), and ultimately showroom’s total earnings.

If your brands send commission statements without a payment, just to report their shipments, you would have entered the commission statements with the invoices ‘pdate’ left blank. The same report can be used to filter “Unpaid” invoices.


commissions report1


On the criteria page, you can enter filters to create very specific reports, such as those analyzing just one rep, just the showroom, or just one manufacturer. Note that you can also filter by paid/unpaid status.

commissions report2


Click “generate report” to see the result of the commission report, like the one below. The report shows commissions broken down by rep (including the showroom rep, i.e. the showroom as a whole) and manufacturer. A summary report only shows reps and the totals of how much they made from each line, while the detailed version lists invoices with their relevant information.

commissions report3


Aiming for Zero – Open Orders Report

The open orders report lists all orders that have not yet completely shipped (i.e.; more than 1% open).

The accuracy of the open order report is dependent on the consistent entry of commission statements (as invoices in Showroom Exchange).

Maximize your revenue!
Use this regularly to followup on open orders (especially after entering commission statements).


open orders


The report criteria page of the open orders report is very similar to other reports (select the filters to define what open orders you want to see).

You can filter by how “open” an order is based on $s (i.e. $500-%1000 open) or % (i.e. over 50% open).

Couple of important noteworthy filters to consider:

“show commission calculation”
Use this check-box to let the brand know the exact commission $ amount due for an outstanding open order. Use “Open $” and “show comm for SR rep only.”

show commission calculation
“Show invoice info (detailed only)”
This is helpful to show existing invoices that you may have already entered from past commission statements.


open orders1


Click generate report to see the report result like the detailed report shown below. Detailed reports show specific PO’s that are still open, broken down by manufacturer and rep, and other relevant information about the order.

open orders2


The summary report show general shipping statistics for each brand.

open orders3


Best practices for the Open Order report:

  • run open order reports after invoice entry
  • look at orders 10%-100% open if orders >10% open are not of interest
  • catch open orders from previous months (or years) by using an earlier date, i.e. 01/01/2001
  • remove open balances that will never ship using bulk cancellation to keep your records clean


Hindsight is Definitely 20/20 – Missed Bookings Report

The missed bookings report analyzes your orders and based on your search criteria, finds customers who have missed bookings. This report is perfect for finding those customers who still need a follow up to make a sale.
Find the Missed Bookings report in the Analysis section of the Reports tab.

missed bookings1


Here are the essential steps for entering your report criteria:

1) Select the manufacturer(s) you are finding missed bookings for

2) Select if you are looking for orders based on order date or cancel date. Cancel date is the option most commonly used.

3) Enter the date range you are looking for missed bookings in. In the example below, we are looking for customers without orders between July 1st and September 30th.

4) Clarify if you are analyzing the period as a whole. This options allows you to specify if you’re satisfied with a customer placing an order for 1 of the 3 months (Jul, Aug & Sep). If so, set to “Yes.”
example: A customer has placed an order for Aug, will not appear in the report.

…or if you would like to see a booking for each month, set to “No”.
example: The same customer will appear in Jul & Sep.

5) This second date range is to help specify which customers you would like to consider. In the example below, the report will 1st pull up customers who have orders between January 1st and June 30th, and will only display those who have not placed an order between July 1st and September 30th. This date range selection helps focus on “active” customers, those with recent bookings and exclude customers that had purchased from the selected brand sometime in the not so recent past.

missed bookings2


After clicking “generate report” the results will look like the example below. Customers with missing orders are listed with their last order/cancel date and their contact info under manufacturers and date ranges.

The next step will be any combination of the following for contacting the customer:

  1. Call them.
  2. Create a note entry.
  3. Tag them for market call (if applicable).
  4. Send a personalized bulk email.


missed bookings3

When is the Best Time to Send an Eblast?

Knowing when to send your bulk email is crucial for optimizing how many people see your content and increasing deliverability.

Most email marketing campaigns are sent between 8-10 AM on Tuesday, Wednesday, or Thursday. However, sending your eblast with everyone else might discourage your message being opened. Statistics are showing that there are other time windows that show better open rates (percentage of recipients that open your message).

  • Weekends see the least amount of emarketing, but these emails typically get the highest open and click through rates (click through rate is the percentage of recipients that click on the links in your message). The weekends are a good time to send out your email campaigns because you’ll have little competition for your recipient’s attention.
  • Messages sent late at night, between 8-12 pm, have a high 22.7% open rate, compared to the usual 17% when sent in the daytime. Click through rates were higher too.
  • No one time/day is perfect for everybody. Try analyzing your recipients and thinking about when they would be most likely to open emails. Send your emails at different times to compare and see what time works best for your business.

reference:
Quarterly Email Benchmark Study

http://www.iab.net/media/file/emailmarketingquarterlybenchmarkstudyq42013.pdf


Recall My Criteria Selections: Don’t Lose What You Were Searching For

With “recall my criteria selections,” you can enter a search/filter on one page, leave the page, and when you come back to it, the search will still be there. “Recall my criteria selections” prevents having to re-enter your search/filter.

For example, if there’s a search for all stores in the zip code 90210 and the page is left to see the orders of one of those stores, the page can be returned to and it will still show all of the stores in 90210.

To enable/disable “recall my criteria selections,” click “customize this view,” the check-box for the feature is at the top of the window. Make sure to click “save selections” when you’re done!

recall criteria selection

Filter with Manage Column Icons (Customer Tab)

Filter customers by icons in the manage column in the same manner you can filter by state, rating, market call label, etc. Doing so can make tasks, such as improving your customer email subscriptions, much simpler.

Click on a particular icon in the top section (the header row) of the manage column (just under the title “manage”) to filter by one of the icon statuses. Click the icon again to filter by a different status within the same category.

manage column filter


For example, if the envelope icon is clicked once, the page will reload and it will list customers with valid email addresses. When the icon is clicked again, the page will filter by customers without email addresses (a good practice to do every once in a while during downtime to update your customer profiles).


manage column filter example


Below are the different icons you can search by and what they mean:

manage column filter globe The globe icon shows if a customer address can be shown on Google Maps. Click once to see those that can be seen on a map, click again to see those that can’t (normally because their address needs to be entered in a different format).

manage column filter emailThe envelope icon shows if a customer has a valid email address in SE or not. Click once to see customers with a valid email address, twice to see those without an email address, three times to see invalid email addresses, and four times to see accounts that have emails but are missing a primary email address.

manage column filter money problemsThe dollar sign is a marker to denote a customer that has money/credit issues. Click once to see customers that have not been marked, click twice to see customers marked with having money issues.

manage column filter subscriptionThe envelope with an icon in front of it shows a customer’s email subscription status. Click once to see customers with at least one unsubscribed email.

manage column filter excl list The warning sign icon shows customers that have been excluded from a manufacturer. Click once to see customers not excluded from any manufacturer, and click again to see customers that are excluded from at least one manufacturer.


How Much Excel is Too Much?

Excel has been around for sometime and has become an indispensable tool

While Excel is a great analytical tool and we encourage its use, small businesses must pay attention not just to the amount of time spent on Excel, but also to the frequency of use and what portion of that effort is redundant.

Meet with your team and determine the amount of time you spend manipulating Excel file s on a daily/weekly basis. Determine redundancy and use a simple equation to evaluate the cost to your business. e.g.; 4 hours per week @ $15/hr is just under $3,000/year. This cost does not include loss of efficiency by conducting other non-Excel related tasks.

Contact us to see if there is an existing report that is similar enough to minimize or eliminate your Excel effort , or about the possibility of creating a custom report to eliminate maintenance of an Excel file and free up time for other tasks.

(213) 438-0600 ext. 502
help@readytoview.com


Report Scheduling Reincarnated

This is a major improvement of our Report Scheduling tool.

What makes this special is the ability to use “relative dates” (aka. Multiple Periods), e.g.; Schedule a report “ONCE” to run (indefinitely) at the 1st of every month for the period of the preceding month.

Showroom Owners & Managers:
Relieve your reps & assistants from the task of generating reports for you on regular intervals. Showroom Exchange can do this for you.
You can now schedule automated reports within Showroom Exchange. Configure the settings once and have your reports emailed to you daily, weekly or monthly. The reports will be emailed to the address saved in your settings page. They will include a PDF and CSV/Excel link.


To schedule a report, enter report criteria/filters, then at the bottom of the report, click the “schedule this report” button.
Note: to use relative dates, date criteria entries are not considered for scheduled reports.


schedule report1


In the following pop-up, enter the title of the report (subject line of your email), then select the interval (frequency) of how often/how many times you want to receive the report.

schedule report


Daily, Weekly, and Monthly reports become more detailed as you can choose to make them examine a static period or multiple periods (relative dates).

Selecting a static period means that the reports will examine the same date range (either order date or cancel date) every time a report is run. This is not the preferred date-criteria selection as the same period will be considered for the report over and over again. e.g.; a report scheduled to analyze Jan 2014 generated in Feb 2014 or anytime in the future, will always consider Jan 2014 as the date filter.

With Multiple Periods, every time the report is generated, it will examine a different date range based on the interval and period you select. For example, if you schedule a recurring Daily report for 9 am, with multiple periods, looking at the “Previous period”, you will receive reports that analyze the previous day. i.e.; you arrive at your desk to find yesterday’s activity in your Inbox.

There are more examples below for Daily, Weekly, and Monthly scheduled reports.

The report below is configured to run on Mondays and Fridays of every other week, analyzing sales with cancel dates in the following week. It will run ten times before stopping.

schedule report4


The example report below will run every day @ 11:59 PM forever, analyzing sales ordered on that day.

schedule report6


In the example below, the report will be generated on the first of every third month until 12/31/15 and will analyze sales with cancel dates in the previous month.

schedule report7


On the report page, click “maintain schedule reports” to delete or edit existing scheduled reports.

schedule report5

Seasons & Projections

We offer Seasons & Projections as optional features of Showroom Exchange.

With seasons, you can mark orders by season and season year. This allows you to track, search, and filter orders/customer order history by season.

Below are screenshots of adding an order, the orders tab, and the customer tab with seasons.

seasons6

seasons

seasons2


You may also automate the assignment of Seasons during order entry by defining rule-sets per mfr. e.g.; Assign any order entered for MfrX between 1/1/ANY_Year and 3/30/ANY_YEAR to Fall.

seasons5


The seasons feature also allows you to further analyze your data with two additional reports:
1) Forecasting Analysis by Season and
2) Season Comparison.

seasons4


Forecasting Analysis by Season

The seasons feature lets you make projections of your sales based on seasons. You can assign projected dollar values to customers as well as mfr’s (see below).

assign projection2 assign projection


You can then use the “Forecasting Analysis by Season” report to summarize your projections as well as compare them to your actual sales once orders have been entered (see below).

assign projection1


assign projection3


Season Comparison

In the Season Comparison Report, you can compare bookings by season and year, much like mfr yearly comparison and cust yearly comparison. Below, a sample report result:

seasons3


If you’re interested in activating the Seasons and Projections add-on to your showroom’s account, send us an email to help@readytoview.com and check out our pricing page for details:
https://www.showroomexchange.com/pricing.aspx