How Much Excel is Too Much?

Excel has been around for sometime and has become an indispensable tool

While Excel is a great analytical tool and we encourage its use, small businesses must pay attention not just to the amount of time spent on Excel, but also to the frequency of use and what portion of that effort is redundant.

Meet with your team and determine the amount of time you spend manipulating Excel file s on a daily/weekly basis. Determine redundancy and use a simple equation to evaluate the cost to your business. e.g.; 4 hours per week @ $15/hr is just under $3,000/year. This cost does not include loss of efficiency by conducting other non-Excel related tasks.

Contact us to see if there is an existing report that is similar enough to minimize or eliminate your Excel effort , or about the possibility of creating a custom report to eliminate maintenance of an Excel file and free up time for other tasks.

(213) 438-0600 ext. 502
help@readytoview.com


Report Scheduling Reincarnated

This is a major improvement of our Report Scheduling tool.

What makes this special is the ability to use “relative dates” (aka. Multiple Periods), e.g.; Schedule a report “ONCE” to run (indefinitely) at the 1st of every month for the period of the preceding month.

Showroom Owners & Managers:
Relieve your reps & assistants from the task of generating reports for you on regular intervals. Showroom Exchange can do this for you.
You can now schedule automated reports within Showroom Exchange. Configure the settings once and have your reports emailed to you daily, weekly or monthly. The reports will be emailed to the address saved in your settings page. They will include a PDF and CSV/Excel link.


To schedule a report, enter report criteria/filters, then at the bottom of the report, click the “schedule this report” button.
Note: to use relative dates, date criteria entries are not considered for scheduled reports.


schedule report1


In the following pop-up, enter the title of the report (subject line of your email), then select the interval (frequency) of how often/how many times you want to receive the report.

schedule report


Daily, Weekly, and Monthly reports become more detailed as you can choose to make them examine a static period or multiple periods (relative dates).

Selecting a static period means that the reports will examine the same date range (either order date or cancel date) every time a report is run. This is not the preferred date-criteria selection as the same period will be considered for the report over and over again. e.g.; a report scheduled to analyze Jan 2014 generated in Feb 2014 or anytime in the future, will always consider Jan 2014 as the date filter.

With Multiple Periods, every time the report is generated, it will examine a different date range based on the interval and period you select. For example, if you schedule a recurring Daily report for 9 am, with multiple periods, looking at the “Previous period”, you will receive reports that analyze the previous day. i.e.; you arrive at your desk to find yesterday’s activity in your Inbox.

There are more examples below for Daily, Weekly, and Monthly scheduled reports.

The report below is configured to run on Mondays and Fridays of every other week, analyzing sales with cancel dates in the following week. It will run ten times before stopping.

schedule report4


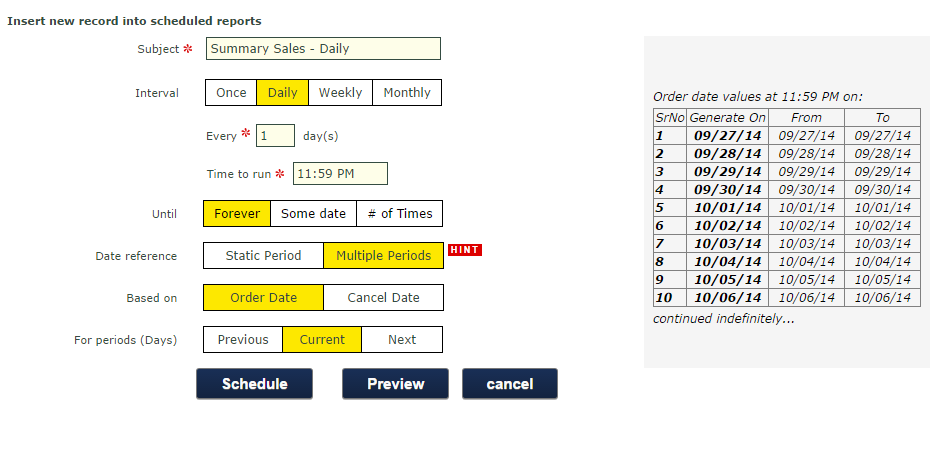
The example report below will run every day @ 11:59 PM forever, analyzing sales ordered on that day.

schedule report6


In the example below, the report will be generated on the first of every third month until 12/31/15 and will analyze sales with cancel dates in the previous month.

schedule report7


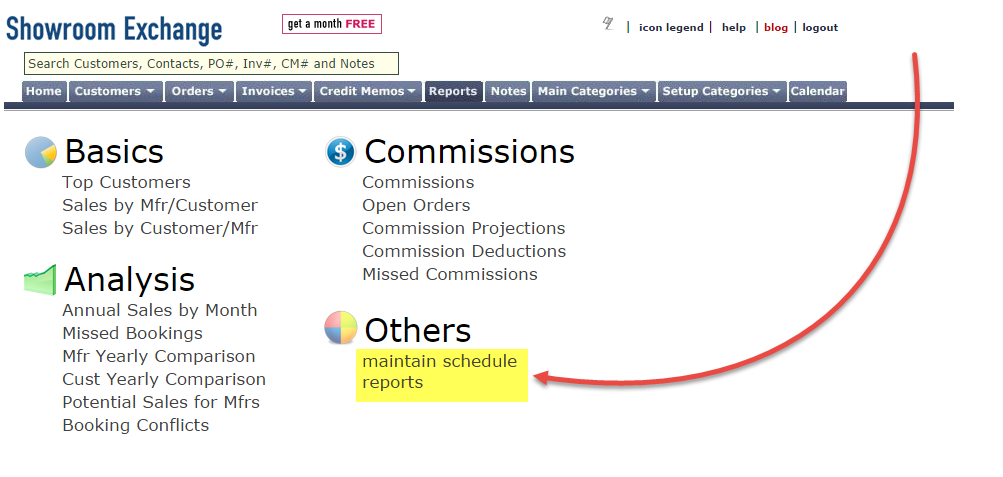
On the report page, click “maintain schedule reports” to delete or edit existing scheduled reports.

schedule report5

Seasons & Projections

We offer Seasons & Projections as optional features of Showroom Exchange.

With seasons, you can mark orders by season and season year. This allows you to track, search, and filter orders/customer order history by season.

Below are screenshots of adding an order, the orders tab, and the customer tab with seasons.

seasons6

seasons

seasons2


You may also automate the assignment of Seasons during order entry by defining rule-sets per mfr. e.g.; Assign any order entered for MfrX between 1/1/ANY_Year and 3/30/ANY_YEAR to Fall.

seasons5


The seasons feature also allows you to further analyze your data with two additional reports:
1) Forecasting Analysis by Season and
2) Season Comparison.

seasons4


Forecasting Analysis by Season

The seasons feature lets you make projections of your sales based on seasons. You can assign projected dollar values to customers as well as mfr’s (see below).

assign projection2 assign projection


You can then use the “Forecasting Analysis by Season” report to summarize your projections as well as compare them to your actual sales once orders have been entered (see below).

assign projection1


assign projection3


Season Comparison

In the Season Comparison Report, you can compare bookings by season and year, much like mfr yearly comparison and cust yearly comparison. Below, a sample report result:

seasons3


If you’re interested in activating the Seasons and Projections add-on to your showroom’s account, send us an email to help@readytoview.com and check out our pricing page for details:
https://www.showroomexchange.com/pricing.aspx

Housekeeping: Avoid Data Redundancy, e.g.; Market Codes & Year

It’s redundant to save categories with the year value as it is already provided during entry (see picture below). For example, some showrooms will save a market with the year, such as “Coterie Feb 2013” and “Coterie Feb 2014.” It’s best to have just one “Coterie Feb.”

Categories that often get years added to them are Markets, Seasons, and sometimes Territories. While everyone uses Showroom Exchange differently, we recommend that nothing created under “Setup Categories” should have a year next to it.

Including the year in a category can have undesired effect other SE features (i.e. reporting). For example, say you want to use the Customer Comparison report to compare your customers between this year’s and last year’s market. If you have one saved as “Coterie Feb 2013” and the other saved as “Coterie Feb 2014,” analyzing the report will be more challenging.

If you have any questions or concerns about this, let us know at help@readytoview.com or call us at 213 438 0600 ext. 502.

category years redundancy

PBE Eblast Analytics

Who is Opening Your Email Blasts?

See who is or isn’t receiving your Eblasts, opening your messages, or clicking on the links inside.

Click to learn more…


Keep an Eye on Your Unsubscribers & Re-Engage Them

After you send a bulk email, see who unsubscribes and possibly reengage with them.

Click to learn more…

Drive Guardian – SAFER DRIVING FOR TEENS & EMPLOYEES

10636288_679353738815977_2854224038484386394_n

The new app DriveGuardian, a r|t|v project, has launched!
There have been too many tragic stories of Texting & Driving. This app was created to make a difference.
The app should be installed on the driver’s cell phone (be it son, daughter, mom, dad, sibling, friend, or employee), by the responsible party.
When the app senses motion, it temporarily limits phone functions to calling up to 4 contacts & 911.
Please pass the word on. A favorable rating is greatly appreciated.
DriveGuardian is only for the Android phone… Why not the iPhone?
At the present it is not possible to override the iPhone’s (iOS) home button. This contradicts the purpose of the App.

For download or more info check out the site:

Keep an Eye on Your Unsubscribers & Re-engage Them

From the PBE (“Personalized Bulk Email”) Sent Items page, you can manage the email recipients that have unsubscribed.

After clicking on PBE sent items under the customer tab (shown below), click on the envelope icon (below the ‘to’ column) by any message to view the addresses it was sent to.

A subscription icon will appear next to each email address. Just like on the customer tab, clicking on the icon will show their subscription status as well as an email template you can send asking the receiver to resubscribe.
IT IS BEST to do this while you’re on a call with the respective recipient, otherwise this may be considered further spamming. The same approach should be considered daily when engaging your customers (from the customer tab).

Note: Any email addresses with an unsubscribed icon does not necessarily mean that they unsubscribed from the same e-blast.

Who is Opening Your Email Blasts?

Showroom Exchange allows you to view the statistics of your sent personalized bulk emails (PBE), such as open-rate, click-through rate, and bounced emails.

From the Customer tab, click “PBE sent items” to show a list of all of your showroom’s most recent e-blasts.

Click on the pie chart to see the statistics of the respective e-blast.


After clicking on the pie chart, you can view a break down of how your recipients have engaged with your message. It is best to view the chart 24 to 48 hours after sending, as recipients rarely open e-blasts immediately.

Out of the total messages sent, you can see how many were delivered and how many bounced. Delivery does not suggest the recipient has viewed the e-blast.

The next section breaks down the bounced emails, showing why the messages did not reach the recipients.

Open Statistics shows how many recipients opened the email and how many clicked on embedded links (if any).

By clicking on the number next to a statistic, you can view the associated email addresses. In the example below, clicking on the 3 next to “Recipients Opened” shows the three addresses that opened this email.

sent pbe3