Sorting Customers, Orders, Invoices, Etc.

Most views (pages) in Showroom Exchange (customer, order, invoice, and notes tab, etc.) allow you to sort your entries by multiple columns. For example, you can sort your customers alphabetically by their name.

To figure out how a page is currently sorted, look at the titles of the column headers. If there is a number with a green arrow above or below it, that means that your data is being sorted by that column (see example below) in ascending or descending order.

If the arrow is pointing up, that means that the column is being sorted alphabetically, beginning at the top and going down (A > Z). If the arrow is pointing down, the reciprocal is true (Z > A), descending order.

sorting1


To clear or reset the current sorting criteria, click on the icon of the two red arrows pointing at each other.

sort1


After clicking this icon, you can reassign the sorting criteria by clicking on the column header title you’d like to sort by. For example, if you want to sort by state, click on “State” column header. If you’d like to sort by this column in the opposite direction, click on the title again to reverse the order. Click once more to remove sorting on the respective column.

sort2


If you want to consider a second sorting criteria, click on the title of the second column you’d like to sort by. For example, if you’d like to sort by state and within each state, you’d like to sort by customer name, first click on “State,” then click on “Customer.” Note the label 1 & 2 signifying the order of the sort.

sort3


Related: Want to skip the wait time when sorting multiple columns?


Customizing Your Excel PO Import

The video below is a demo of how you can adjust the excel order import template to fit your showroom’s identity. Most importantly, it covers cell names in excel, their significance, and how you can move/edit/delete them to your liking.

This article is related to the Excel Order Import Add-On feature. More on this feature here.

https://youtu.be/OfyeltpUjPQ

Using JSC with Chrome

If you cannot download JSC from Google Chrome, follow the instructions below…
STEP1: In your URL bar, enter: “chrome://flags/#enable-npapi” without the quotation marks
STEP2: Click the Enable link for the “Enable NP API” configuration option.
STEP3: Click the Relaunch button that now appears at the bottom of the configuration page.


Why do you have to do this?
see the following URL for more info…
http://java.com/en/download/faq/chrome.xml

Invoice Import Add-On

Showroom Exchange offers an optional feature that allows you to bulk-import invoices (your commission statements).
Ask your brands/mfrs to send your commission/shipment reports in an Excel sheets that includes the expected information, such as mfr po #, invoice #, amount shipped, date paid, etc.,
You can import this information all at once, eliminating data-entry.

Once the optional feature is activated, you can access it from the reports tab and by clicking “import/export options” to bulk import invoices.


invoice import


The next page is where you can both download a sample invoice import excel template file and submit the invoice import files for processing. To download the template file, click on the link “SR_Invoices” at the bottom of the page. To import a completed file or a .zip of completed Excel files, click browse, select the file, then click “submit” at the bottom of the page.

NOTE the section titled “Important:”, it contains important requirements necessary to properly import invoices.


invoice import2


Showroom Exchange will then process the invoices on the provided excel sheet.

1) The following page shows you how many records will AND won’t be imported (due to errors or missing info).
2) To see why records might not have been imported, click on the TXT or CSV links to download error logs.
3) Click proceed to save the successfully imported invoices

invoice import3


Import Excel Orders/POs Add-On

We’ve released a new add on that will allow showroom reps/users the ability to bulk import orders from excel sheets.

By entering your orders on an excel sheet, you not only save paper and make your business “greener,” but you can save time by not having to re-enter all of the information again into Showroom Exchange! Much like the Joor/NuOrder Import Module or the Invoice Import Module, you can import a large number of excel files at once, saving you time.

Once the feature is activated, go to the reports tab to import Excel Order Files

excel imports1


The following page is where you can select your Excel file or .zip file of multiple Excel files to import into Showroom Exchange.


A template of a PO Excel sheet is provided for your convenience, select the “Click Here” link to download the sample template file.

excel imports4


Below is the template Excel Order File that downloads when you click the link:
Excel Order Template


You can customize the Excel file for your showroom. you can change the logo, change the layout, etc.However ALL NAMED cells must also be included in your custom version. You can move these cells around, just make sure the name stays the same.

To be clear, the NAME of a cell is different than the value entered in the cell.

See the image below for a list of all of the cells with assigned names, as well as an example of a name in Excel.

excel imports9


Note: In the grid that contains the actual order, we use Excel mathematical equations to provide a unit total and an amount total to import into SE.

Once you have imported an excel file or a .zip file of Excel files, you will be taken to the page depicted below to verify your customer information and fill in any information that might have been missing from the Excel PO.

1) If the system is not recognizing a customer that is already an existing customer, select the “Assign” option to link the row to an existing customer.

2) “Map” means that this aspect of the customer has yet to be assigned. Click “Map” to select the correct value for the customer. If you try to save the customers and you see the warning “Please map customer data,” this suggests that there are still unassigned/missing values for the respective customer row.

3) Click “List Orders” to go to the next page

excel imports6


The order edit page is very similar to the previous page- here you can make edits, as well as add info that might not have been on the Excel PO, e.g.; rep, commission etc. Here too, you’ll find the “Map” option if something is missing on the excel order. If you can’t process the orders when you click “Import Orders,” look at the column on the far right to see an explanation as to why the order could not be imported. Make the edits to then properly save the orders.

excel imports 7


After clicking “Import Orders”, you’ll be taken to a confirmation page where you can see if your orders and customers were imported or not.

excel imports8

Order Scan Size Limitations

You’ll notice when uploading .zip file order scans, the size limitation warning as shown in the screenshot below. It states the maximum file-size of a single order scan should be no more than 1500 KB (or 1.5MB). And the maximum resolution should not exceed 1000 pixels x 1200 pixels.

order scan import size limitation


What should you do if your file size is too big?

There are many different programs (that help manipulate images in bulk) on the internet that allow you to reduce that size (both in size and resolution) of your large images.

We at Showroom Exchange use ACDSee (standard version): http://www.acdsee.com/en/products/acdsee-18

ACDSee allows us to bulk reduce multiple images before uploading.
There are free options. here is 1 link.
NOTE: This is not an endorsement:

19 Best Free Bulk Image Converter


Waze Your Road Trip with Showroom Exchange

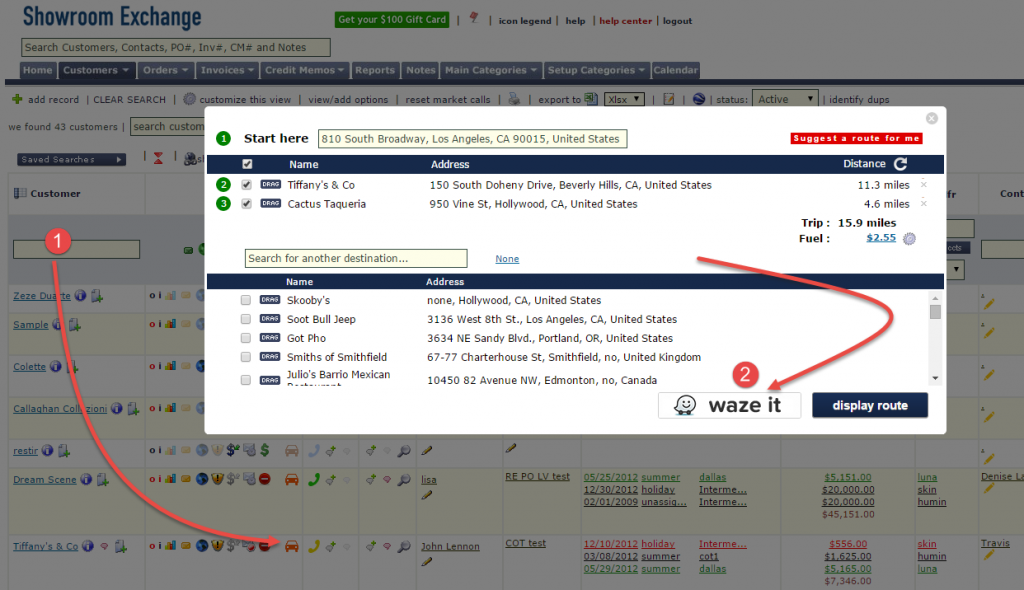
Showroom Exchange’s driving directions feature now has an option to send your trip plan to your Waze app!

Waze is a GPS-based navigation app for smartphones which provides turn-by-turn information and route details

Select the customers you want to visit as you normally would in the driving directions app (visit: http://blog.showroomexchange.com/the-new-and-improved-driving-directions/ for more info). Rather than clicking on “display route,” click on “waze it.”


waze1.2


An email will be sent to you. Open it on your smart-phone and it will look something like this…
Each link represents a different customer location. Click them one at a time to open the location in your Waze app.

waze2


Annual Sales by Month Report

The Annual Sales by Month report is a great way to analyze your sales and/or shipping metrics by month. This report is highly customize-able.

From the reports tab, as shown below (1), click “Annual Sales by Month” (2).

annual sales by month4


(A) As shown below, the first step is to select the time frame grouping for $s you wish to analyze. Orders have several dates assigned to them. Would you like to group $s based on their order date or cancel date?

(B) In the “order status” drop down, you can select what kind of data you wish to see in your report: active $’s, booked $’s, shipped $’s, cancellation $’s, ship/active%, etc.

(C) The rest of the left side of the page is standard filtering as found in other reports. Use these options for altering the focus of your report to a specific subset of your data.

(D) The right side of the screen is where you choose what aspects of the data you wish to display. Check off the box under the “show” column to include the aspect in the report.
While this grid might be confusing at first, we’ve included some pre-set scenarios to start you off and help you understand the logic.
You can also select which aspect you want to sort by. For example, click the option next to customer code and under “sort” to show your results in alphabetical order by customer name.
The subtotal column allows you to see subtotals by the aspect you check off under that column. For example, see total values for each individual customer.
Check the “customer detail” box to see each customer’s contact information.
Check “show % +/- difference” to see the percentage change from month to month

annual sales by month5


Click “generate report.” you’ll see a results page much like the one shown below. The grid is organized with the options you’ve selected as the columns on the left, with months and year totals on the right. Each row represents a specific customer/rep/territory/ etc.

We do recommend that you use the Export to Excel option for further analysis.


annual sales by month3